Analytics AI & Dashboards
Get the big picture with visual dashboards and every detail with Corso AI. The most advanced analytics tech stack for your post-purchase data. Let's grow.
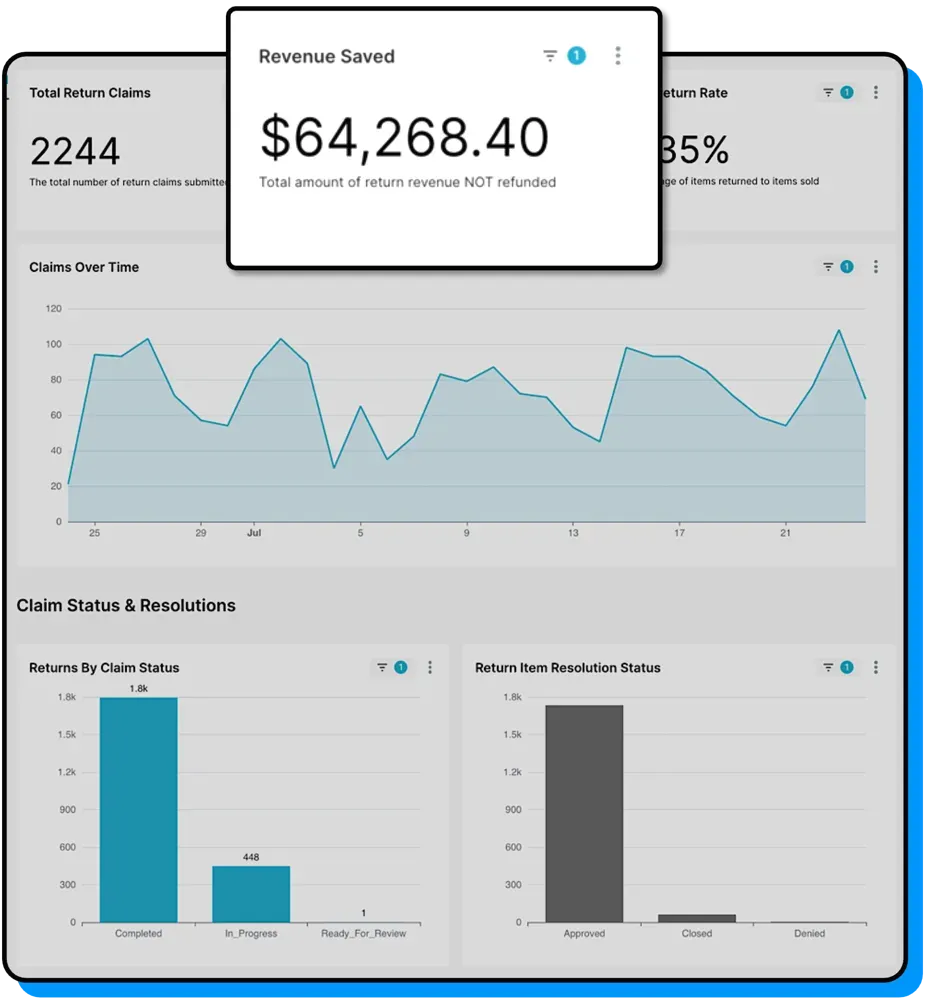
Know how claims impact your business
Monitor how your returns and warranty programs are performing with insightful charts and data. Discover how to reduce returns and retain revenue by connecting data to Corso's advanced automation rules. See how your policies are trending as you make real-time improvements.
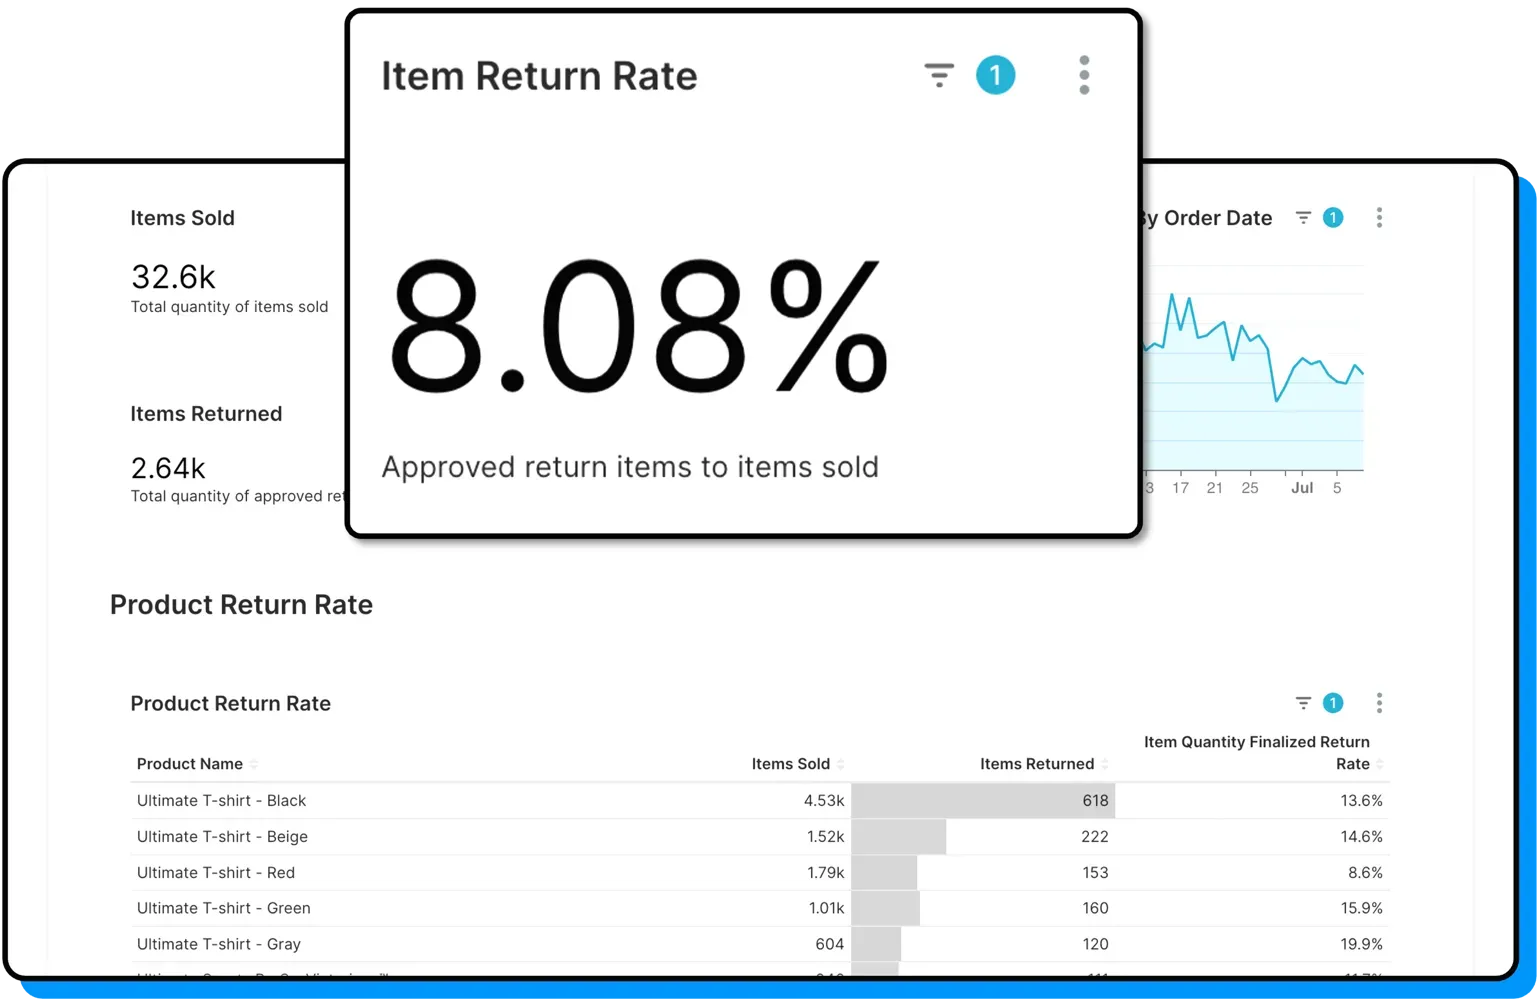
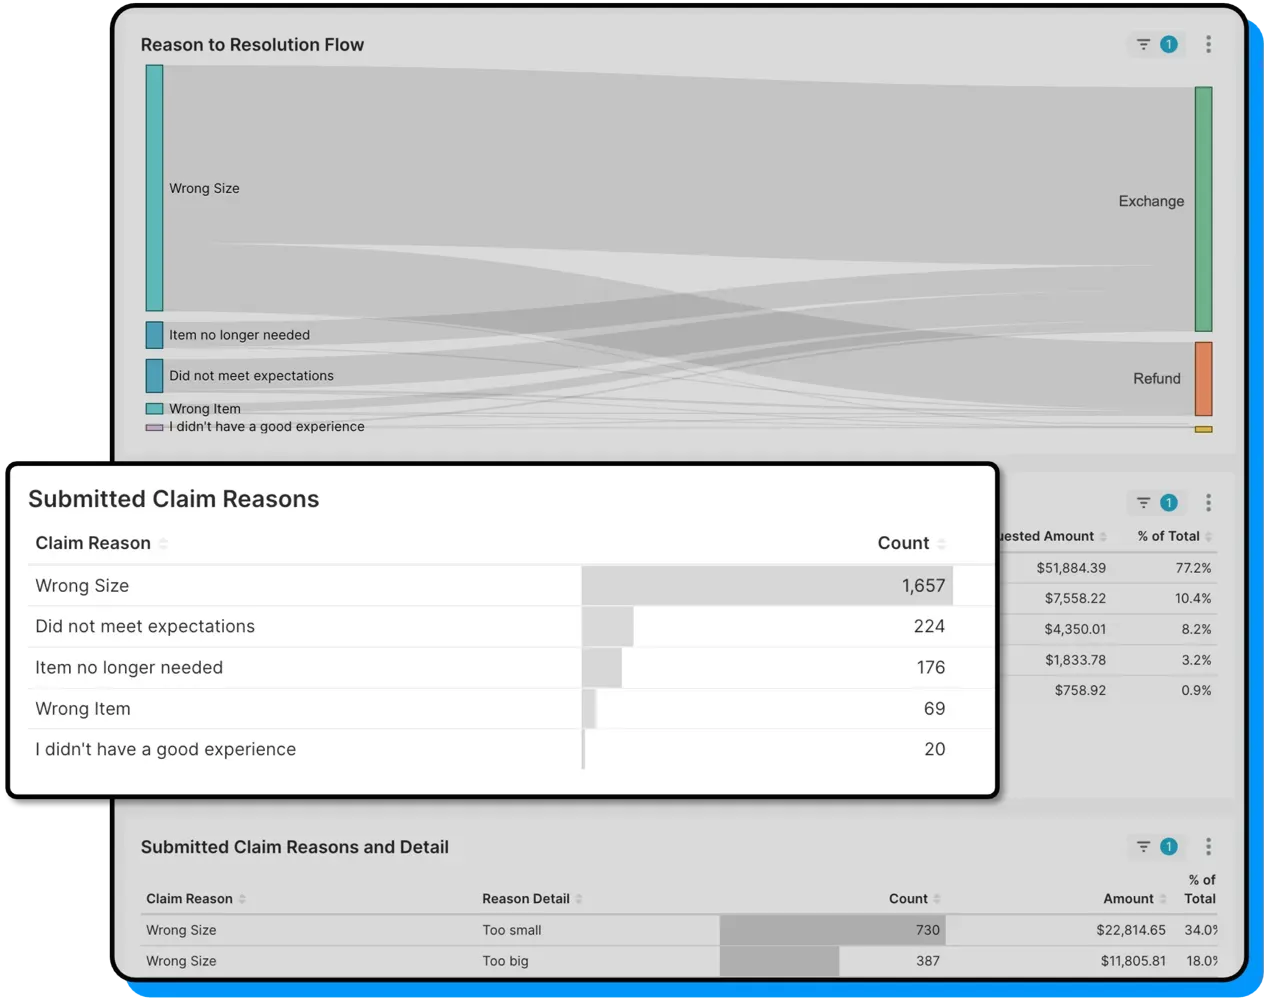
Understand which products, and why
Know which products are being returned and why, at the product and variant level. Prevent unnecessary returns and earn more satisfied customers from the start.
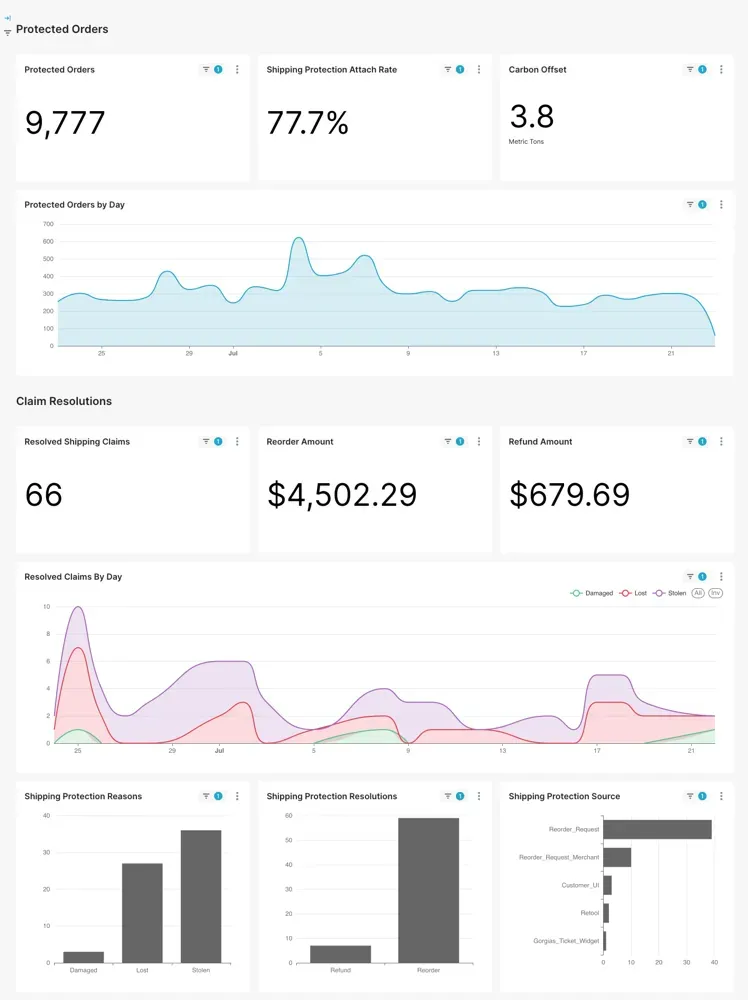
Shipping Protection analytics
Watch the performance of your Shipping Protection program with live dashboards that track protected orders, claims, and even sustainability.
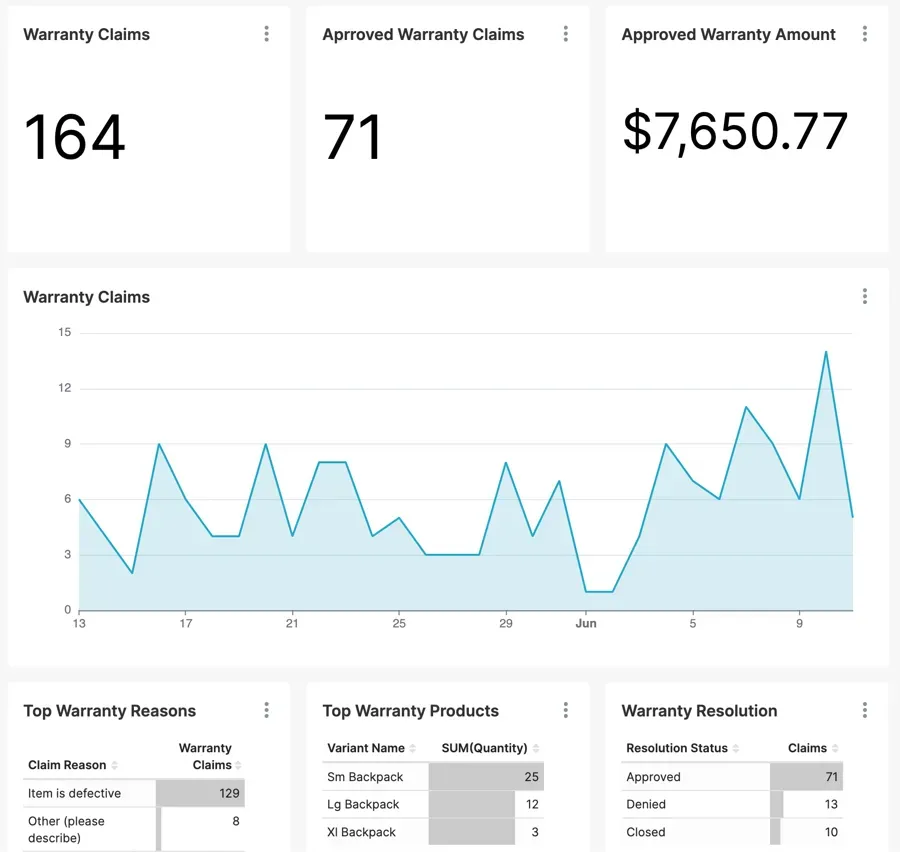
Warranty analytics
Know which products are receiving the most warranty requests and how much your warranty program is costing. Get the data you need to make improvements at every step.
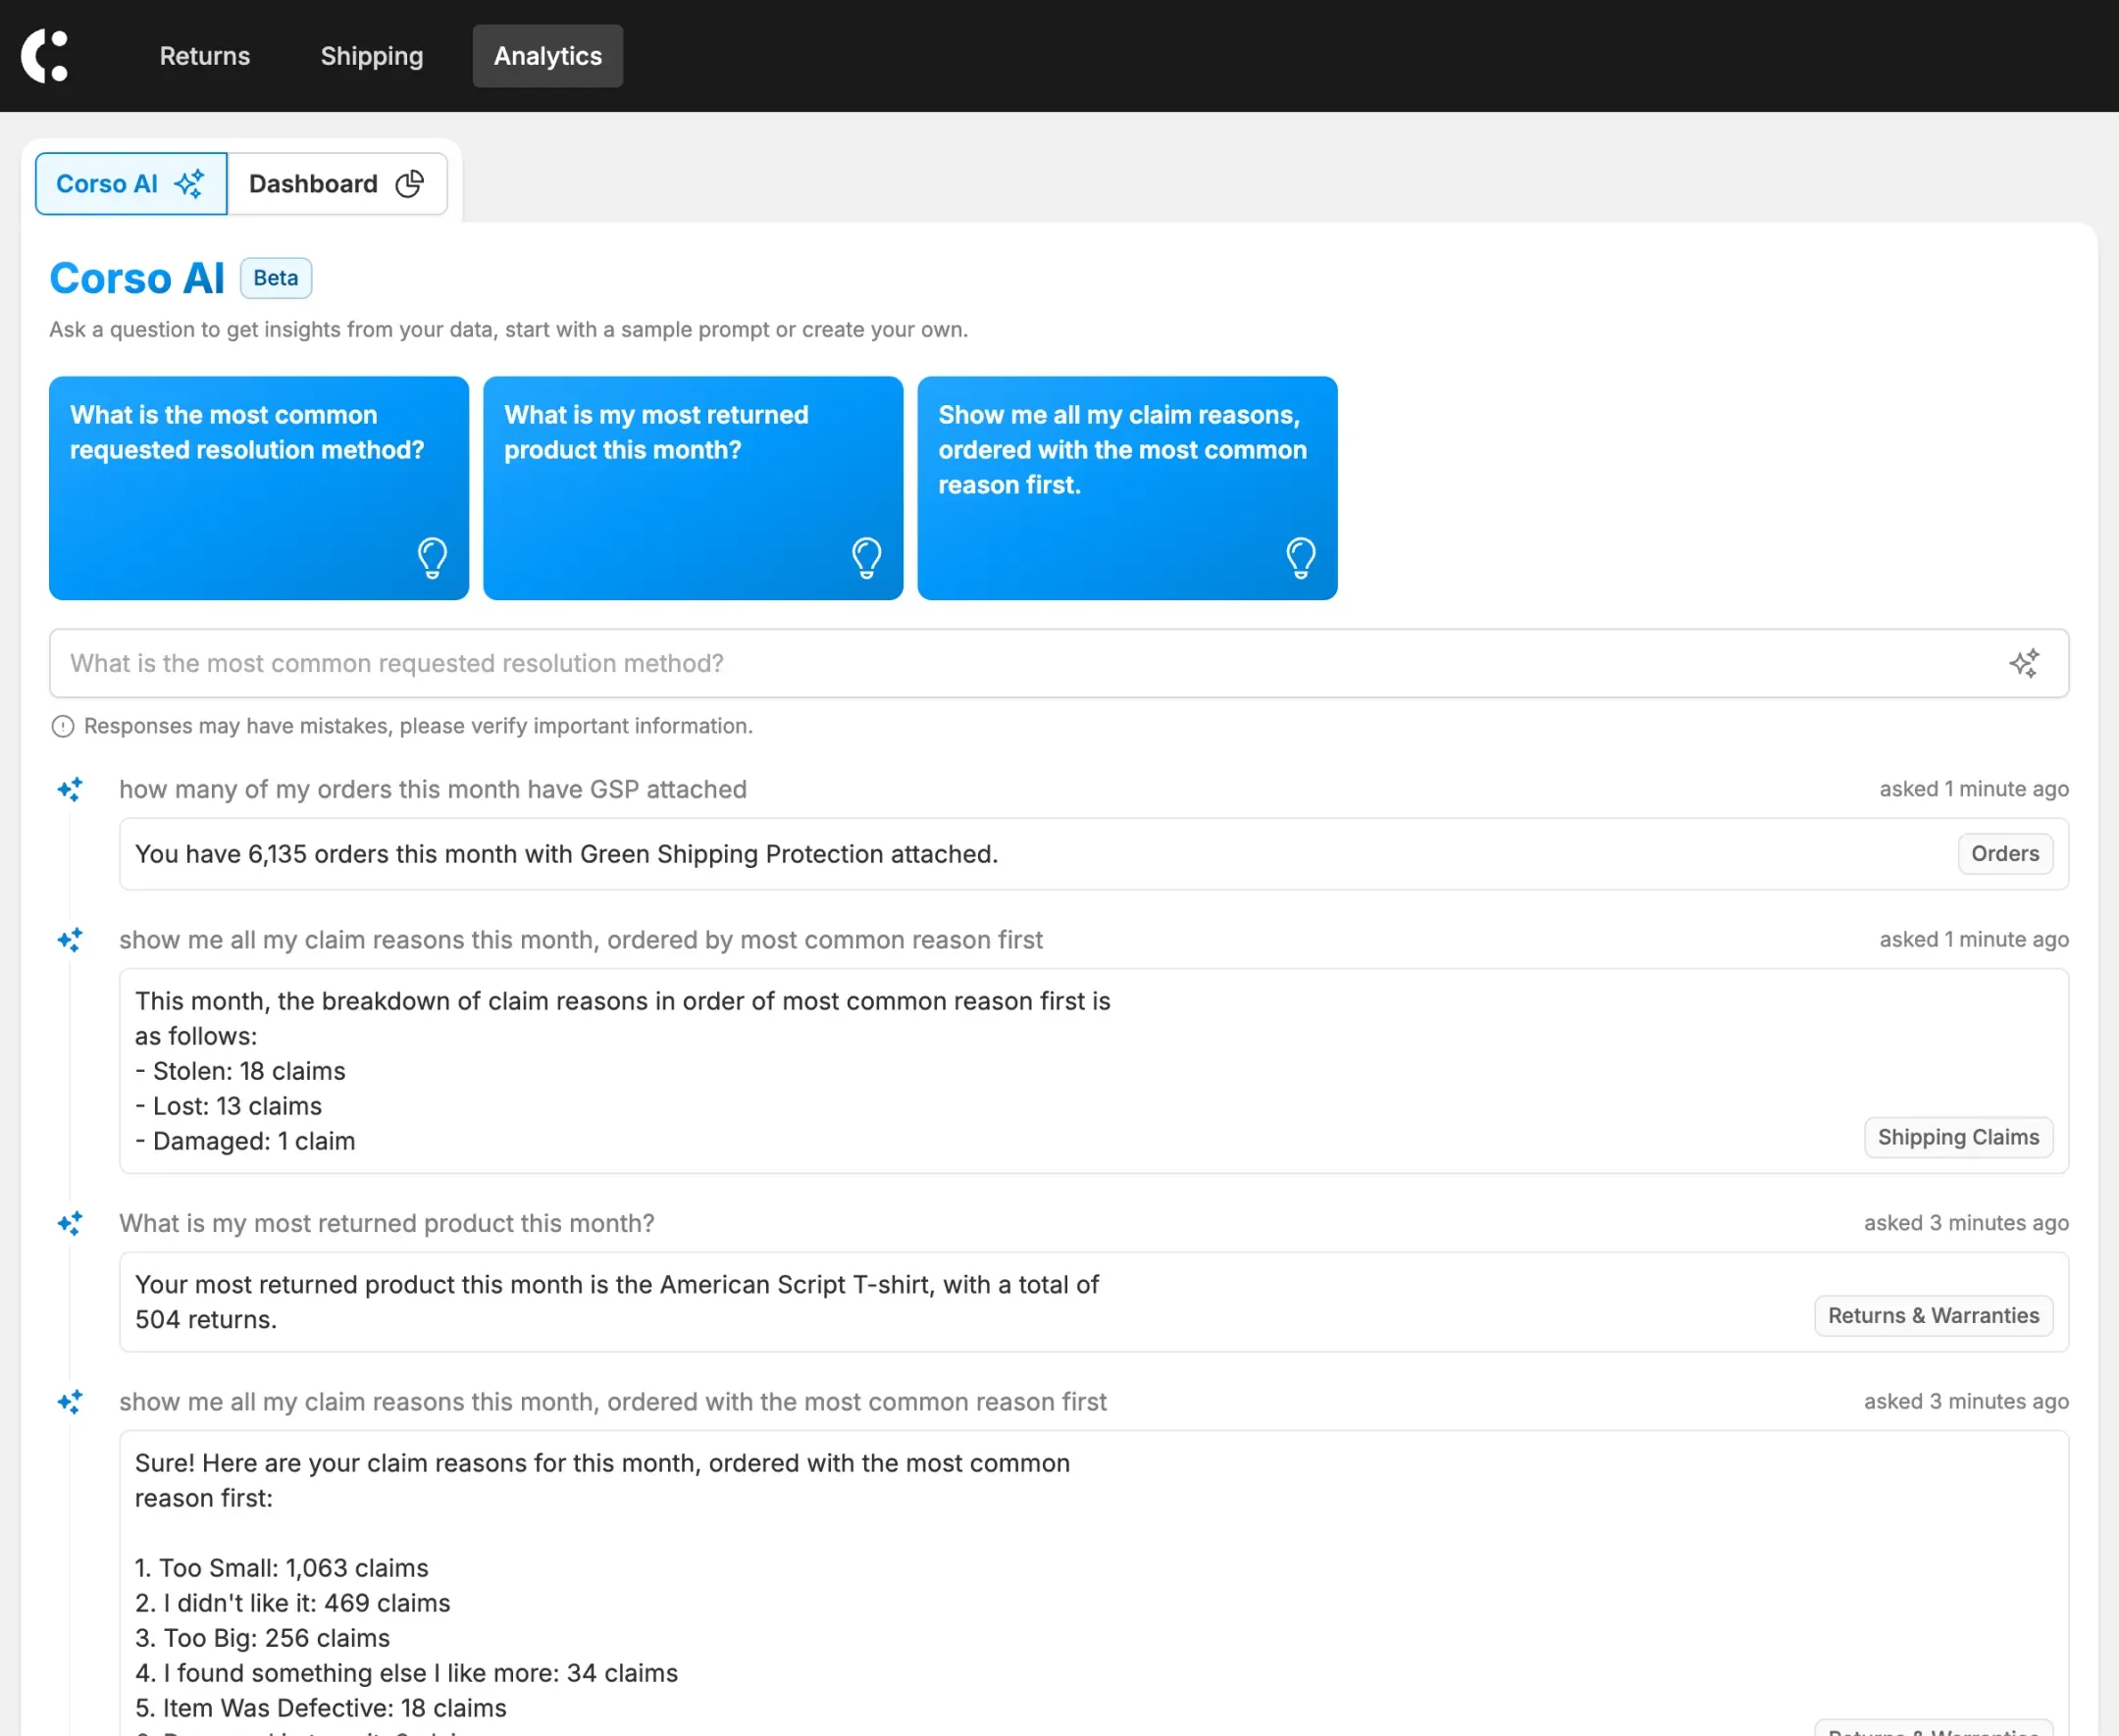
Corso AI
Ask any shipping, return, or warranty question — Corso AI surfaces every detail in your data.